Last reviewed: 2026-08-05 (UTC)
Two useful national reference points are about $2.60/W for current competitive marketplace quotes and $4.00/W as the median for 2024 completed host-owned projects. For an 8 kilowatt (kW) system, those rates work out to about $20,800 and $32,000 before incentives.
They are different datasets, not low and high bounds for a base installation. The first is a July 2026 average from competitive quotes on the EnergySage marketplace. The second is the median for a broad set of completed projects in Berkeley Lab's latest installed-project dataset. Online averages can measure different systems, payment methods, and project scopes.
Your real solar panel installation cost depends on system size, location, roof and electrical condition, equipment, installer, and payment method. A battery, roof replacement, electrical service upgrade, or loan fees can add thousands of dollars.
One more 2026 update matters: a new homeowner solar installation completed in 2026 does not qualify for the former 30% federal Residential Clean Energy Credit. Do not let a proposal subtract that expired credit from your price.
Solar panel installation cost by system size
Solar installers usually compare prices in dollars per watt. The basic calculation is:
System size in watts x cash price per watt = gross installed price
These examples show two legitimate planning lenses before incentives:
| System size | At $2.60/W: current marketplace benchmark | At $4.00/W: completed-project median benchmark |
|---|---|---|
| 4 kW | $10,400 | $16,000 |
| 6 kW | $15,600 | $24,000 |
| 8 kW | $20,800 | $32,000 |
| 10 kW | $26,000 | $40,000 |
| 12 kW | $31,200 | $48,000 |
Use the table to check the scale of a quote, not to set a guaranteed fair price. A quote can reasonably land outside these figures because of local labor and permitting, financing, premium equipment, roof complexity, or work that is not part of the solar array itself.
Cost per watt is most useful when every quote is:
- For the same direct-current system size.
- A cash price before incentives.
- For solar panels without a battery.
- Based on comparable equipment and warranties.
- Clear about roof, electrical, permit, and utility work.
Do not size solar by square footage alone
A 2,000-square-foot house does not have one standard solar cost. Two homes with the same floor area can use very different amounts of electricity because of climate, insulation, heating fuel, air conditioning, appliances, an electric vehicle, or household habits.
Start with at least 12 months of electricity use in kilowatt-hours. Adjust that baseline for planned loads such as an EV or heat pump, then model how much energy a system can produce on your roof. The National Laboratory of the Rockies' PVWatts calculator is a useful independent check, although it is still an estimate rather than a production guarantee.
If an EV is part of the load, Watt Wallet's guide to solar panels for electric car charging explains how to estimate the added electricity first.
Why solar cost averages disagree
Three current evidence sources illustrate why a single average can mislead:
| Source and data type | Price lens | What it represents |
|---|---|---|
| EnergySage, July 2026 marketplace data | About $2.60/W; $31,135 overall average, with a typical system size of about 12 kW | Competitive quotes submitted through one marketplace, before incentives |
| DOE/NLR Q1-2025 model | About $2.95/W, or $23,600 for the representative 8 kW system, in 2024 dollars | A bottom-up modeled market price on a DC-watt basis, not an observed homeowner invoice |
| Berkeley Lab, projects installed in 2024 | $3.00/W at the 20th percentile, $4.00/W median, $5.20/W at the 80th percentile, in real 2024 dollars | Self-reported gross prices per DC watt for completed homeowner-owned systems, including cash and loans |
None is automatically the "correct" number for your house.
Marketplace quotes can run lower because installers are competing for the same customer. A cost model builds a representative system from equipment, labor, business, and process inputs. Completed-project data capture what people reported paying, including some financed and complex jobs.
Before using any online number, check five labels:
- Data date: Confirm when the quotes or installations were recorded.
- System size: Confirm whether the total is for 6 kW, 8 kW, 12 kW, or something else.
- Payment method: Confirm whether it is cash, loan-financed, leased, or mixed.
- Incentive treatment: Confirm whether the price is gross or net of incentives.
- Scope: Confirm whether it includes a battery, roof work, electrical upgrades, or other adders.
What is included in solar installation cost?
An installed solar price is much more than the retail price of panels. A typical turnkey quote can include:
- Solar modules.
- Inverter equipment.
- Roof attachments, flashing, rails, and clamps.
- Wiring, connectors, breakers, grounding, and monitoring.
- Site assessment and electrical design.
- Permit and utility interconnection applications.
- Delivery and logistics.
- Installation, testing, and inspection support.
- Sales and customer acquisition.
- Company overhead, taxes, and profit.
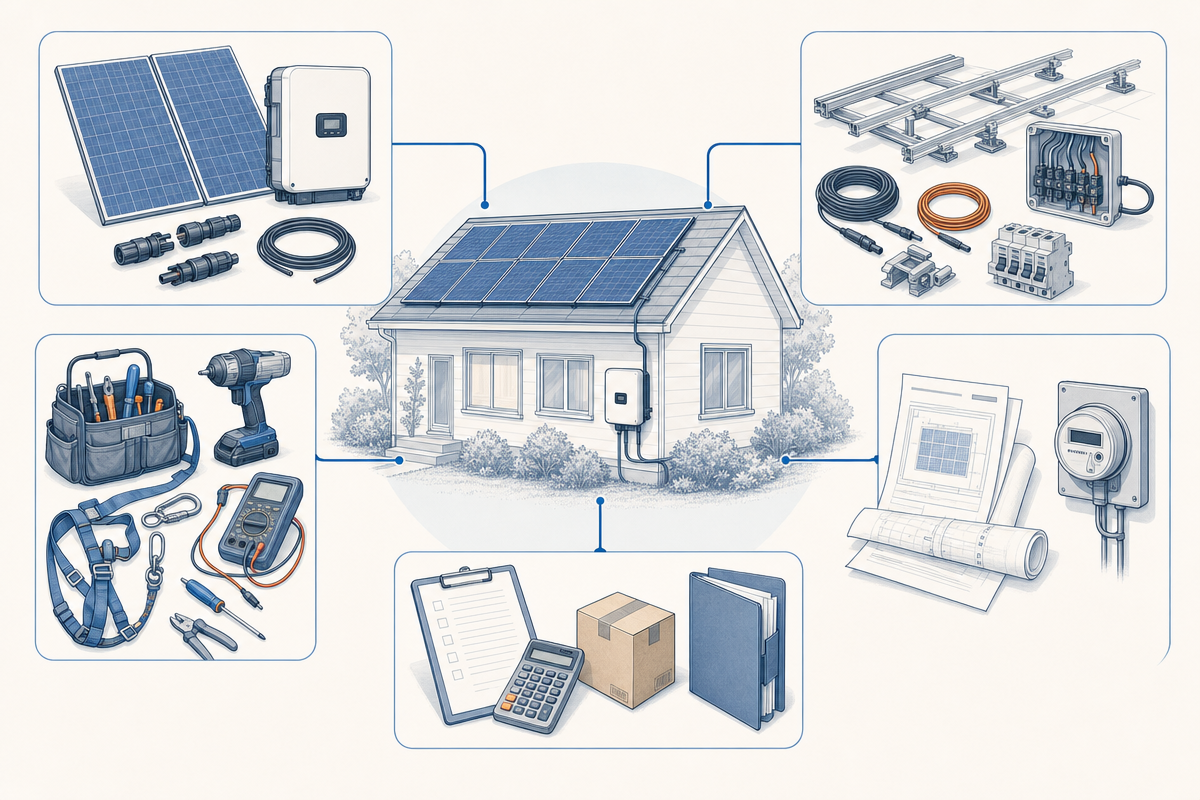
In the Department of Energy's published 2024Q1 model, the rounded hardware categories added to about $1.35/W, while non-hardware categories added to about $1.80/W. These included fieldwork, office work, distributor markup, sales tax, overhead, and profit. The majority of that modeled installed price was outside the panel, inverter, racking, and wiring themselves.
That does not mean an installer must reproduce the federal model line by line. It means a panel-only retail price is a poor way to judge a professional installation quote.
Costs that may sit outside the base quote
Ask the installer to separate the solar array from major adders. The latest federal cost model explicitly excludes roof repair and electrical service upgrades.
| Possible adder | What to confirm |
|---|---|
| Battery storage | Usable kWh, backup circuits, power output, gateway, warranty, installation, permit, and utility scope |
| Roof repair or replacement | Remaining roof life, structural work, flashing responsibility, leak coverage, and future panel removal/reinstallation |
| Electrical work | Main panel, busbar, service size, meter, trenching, utility work, permit, and patching |
| Site work | Tree work, long conduit runs, detached buildings, difficult access, or special roofing material |
| Later lifecycle work | Inverter replacement, monitoring service, and detach-and-reset work for a future roof project |
Treat a battery as a separate budget line
Storage can change both price and project scope. In DOE's published model, an 8 kW solar-only system had a modeled market price of $25,200, while the same solar size paired with a 13.5 kWh battery reached $41,520. Those are modeled 2023-dollar benchmarks, not a current battery quote, but they show why storage should not disappear inside one solar cost-per-watt figure.
A battery quote should state usable energy, continuous and surge power, which loads it backs up, required electrical equipment, and its incremental installed price. Whole-home backup and a small critical-loads system are not the same product.
Make roof and electrical contingencies explicit
Have the roof assessed in person. If its condition or structure is uncertain, get a separate opinion from a qualified roofer or structural professional. Replacing a roof before solar can avoid paying to remove and reinstall the array later.
For electrical work, ask what exact code, busbar, service, meter, or utility rule triggers the proposed upgrade. "Old panel" is not enough explanation for a large change order. Ask whether a different interconnection design or utility-approved alternative is possible.
If your project may need this work, use a separate line item and compare it with Watt Wallet's electrical panel replacement cost guide.
Cash price and financed price are not the same
Always request the cash price, even if you plan to borrow.
Berkeley Lab's 2024 completed-project data showed median prices of $3.50/W for cash systems and $4.70/W for loan-financed systems. That $1.20/W gap cannot all be assigned to one cause, but it shows why a low advertised interest rate does not prove a low project price.
The Consumer Financial Protection Bureau found that fees and markups in some solar loans increased the principal by 30% or more above the cash price. Some loans also expected a large later prepayment and raised the monthly payment if the borrower did not make it.
For the identical system, get these figures in writing:
- Gross cash price.
- Financed principal.
- Annual percentage rate.
- Dealer, origination, platform, and lender fees.
- Loan term and total of payments.
- Monthly payment before and after any reset.
- Prepayment, lien, and early-payoff terms.
Be especially careful with a 2026 payment schedule that assumes a 30% tax-credit-funded prepayment. A new 2026 homeowner installation does not generate that federal credit.
Leases and power purchase agreements (PPAs) avoid a conventional purchase price, but they still create a long-term cost. Compare the starting payment or energy rate, annual escalator, maintenance, production guarantee, early termination, roof-work terms, home-sale transfer, and end-of-term options. The third-party owner, not the homeowner, generally receives ownership incentives.
Which incentives can lower the 2026 price?
The federal homeowner solar credit changed before 2026.
The IRS says the Residential Clean Energy Credit is not available for property placed in service after December 31, 2025. Current law treats the expenditure as made when the original installation is completed. Signing a contract or paying before the deadline did not preserve the credit for a later completion.
A valid unused credit from a qualifying pre-2026 project may still carry forward under Section 25D's carryforward rule. That is a filing question about an earlier installation, not a new discount for a 2026 project.
State, local, and utility incentives may still reduce the cost. Search the DSIRE database by ZIP code, then verify each program with its current administrator before signing. Confirm:
- Eligible equipment and ownership type.
- Application timing.
- Funding availability.
- Service territory.
- Income or contractor requirements.
- Whether approval must happen before installation.
- How the incentive affects taxes or other programs.
Watt Wallet's incentives library can help you find selected homeowner programs, but the official program page remains the source of record.
This guide is informational, not tax, legal, or financial advice. Confirm incentive eligibility and contract terms for your own project.
Estimate savings and payback with transparent assumptions
The simplest payback formula is:
Simple payback = net upfront cost / annual net savings
The hard part is calculating annual net savings honestly. Separate:
- Solar used in the home, valued at the retail electricity purchases it avoids.
- Solar exported to the grid, valued at the utility's current export rate.
- Fixed utility charges that remain and therefore must be excluded from avoided-bill savings.
- Maintenance, insurance, and likely component replacement.
- Financing cost.
- Expected production decline over time.
For example, consider a hypothetical $23,600 cash system with a verified $2,000 local rebate. If it produces 10,000 kWh in the first year, the home uses 60% at an avoided retail rate of $0.20/kWh, and the utility credits the other 40% at $0.08/kWh, the gross energy value would be $1,520. Applying the Q1-2025 model's $34/kW-year operating-and-maintenance assumption to an 8 kW system reserves $272 a year, leaving estimated first-year net savings of $1,248. The simple payback is about 17.3 years.
That example is not a forecast. Change the roof, production, rates, export policy, financing, or costs and the answer moves quickly. Run conservative, base, and optimistic cases. Include how long you expect to own the home. For a financed purchase, compare the full loan cash flow or discounted cash flow; dividing financed principal by first-year savings ignores payment timing and the time value of money.
How to compare solar installation quotes
Get at least three site-assessed written proposals. Ask each bidder to use the same comparison fields.
| Compare | Required details |
|---|---|
| Design | System kW DC, annual kWh, percentage of use offset, tilt, azimuth, shade and weather assumptions, losses, degradation |
| Cash price | Gross cash total and cash $/W before incentives |
| Financing | Principal, APR, all fees, term, total payments, payment reset, liens |
| Equipment | Exact panel, inverter, optimizer, racking, battery, gateway, and monitoring models |
| Protection | Product, performance, inverter, workmanship, roof, and production-guarantee issuer, term, remedy, transferability, exclusions, and labor/shipping/removal coverage |
| Scope | Design, permits, inspections, interconnection, meter, roof, electrical, battery, taxes, cleanup, exclusions |
| Project team | Seller, installer, subcontractors, licenses, insurance, operating history, references |
| Contract | Schedule, payment milestones, change orders, cancellation, transfer, termination, permission to operate |
Run the proposed system through PVWatts as an independent production check. Then compare annual savings under your utility's current tariff, including export credits and fixed charges.
Pause when a salesperson claims "free" or government-endorsed solar, guarantees a zero bill or exact payback without written assumptions, pressures you to sign immediately, will not provide a readable contract, or cannot explain why the financed principal exceeds the cash price.
The Federal Trade Commission's solar buying guide offers a useful national checklist. For a deeper incentive-and-quote workflow, see Watt Wallet's guide to comparing rebates, tax credits, and installer quotes.
Bottom line
Two useful national reference points are about $2.60/W for current competitive marketplace quotes and $4.00/W as the median for 2024 completed host-owned projects. They are different datasets, not low and high bounds for a base installation. For an 8 kW project, they work out to about $20,800 and $32,000 before incentives.
Compare quotes on identical cash-price scope first. Evaluate the loan, incentives, utility value, and payback separately. Get three site-assessed bids, confirm every roof and electrical exclusion, and verify local incentive and export rules before you sign.
Sources
- EnergySage: Solar panel cost in 2026.
- DOE/NLR: Q1-2025 solar photovoltaic system cost benchmarks.
- U.S. Department of Energy: Solar photovoltaic system cost benchmarks.
- Berkeley Lab: U.S. Distributed Solar and Storage 2025 Data Update.
- IRS: Residential Clean Energy Credit.
- Consumer Financial Protection Bureau: Solar financing issue spotlight.
- Federal Trade Commission: Solar Power for Your Home.
- National Laboratory of the Rockies: PVWatts.
- U.S. Department of Energy: Homeowner's Guide to Solar.