Published: August 17, 2026
Before buying a home energy monitor, find out what the utility account already provides. Some customers can see 15-minute or hourly interval data, while others get daily or monthly totals or no customer interval access. That free data may answer a timing question. Circuit-level decisions need more detail. A monitor earns its cost when its resolution matches a defined job, such as tracing a base load, separating HVAC from EV charging, or measuring solar self-consumption.
Home energy monitor: the short answer
U.S. utilities had more than 123 million residential smart meters in 2024. Access and granularity still depend on the utility. The Department of Energy says Green Button data may contain 15-minute, hourly, daily, or monthly intervals.
Utility data is enough to find seasonal patterns, high-use days, and loads that coincide with peak-rate hours. It cannot separate a heat pump from an EV charger when both run in the same interval.
When real-time circuit data would change a purchase or operating decision, our default choice is a direct-sensing monitor with eight or 16 branch sensors. Emporia Vue 3 offers the strongest balance for most U.S. homes. The eight-sensor kit covers the largest fixed loads, and the 16-sensor kit suits highly electrified homes or those with several HVAC zones. It requires an active internet connection and uses Emporia's cloud.
Choose the least complicated route that can answer the question:
| Goal | Right starting point | Typical hardware cost | Main limit |
|---|---|---|---|
| Find monthly and time-of-day patterns | Utility portal or Green Button file | $0 | No circuit breakdown |
| Read a compatible smart meter in near real time | Smart-meter bridge | About $40 to $150 | Meter and utility compatibility |
| Measure one ordinary plug-in appliance | Plug-in electricity meter | About $33 to $50 | No hardwired or 240-volt loads |
| See total live household demand | Mains-only panel monitor | About $100 to $300 | No dependable circuit breakdown unless devices are inferred |
| Measure selected hardwired loads directly | Panel monitor with branch sensors | About $150 to $300 | Limited by the installed sensor count |
| Keep detailed history at home | Local-first multi-channel monitor | US$495 for U.S. buyers or C$675 in Canada, plus shipping | Higher price and more setup |
Panel-monitor prices exclude electrician labor. The scope grows with multiple panels, busbar service conductors, crowded enclosures, outdoor equipment, or an unavailable breaker position. Combining the installation with planned panel work can avoid a separate service call.
What a home energy monitor actually measures
Most whole-home monitors use current transformers, or CTs. Large CTs surround the continuous service conductors in a typical U.S. split-phase panel. The monitor combines current readings with a separate voltage measurement to calculate live power. Smaller CTs can measure selected branch circuits such as HVAC, an electric water heater, an EV charger, or a well pump.
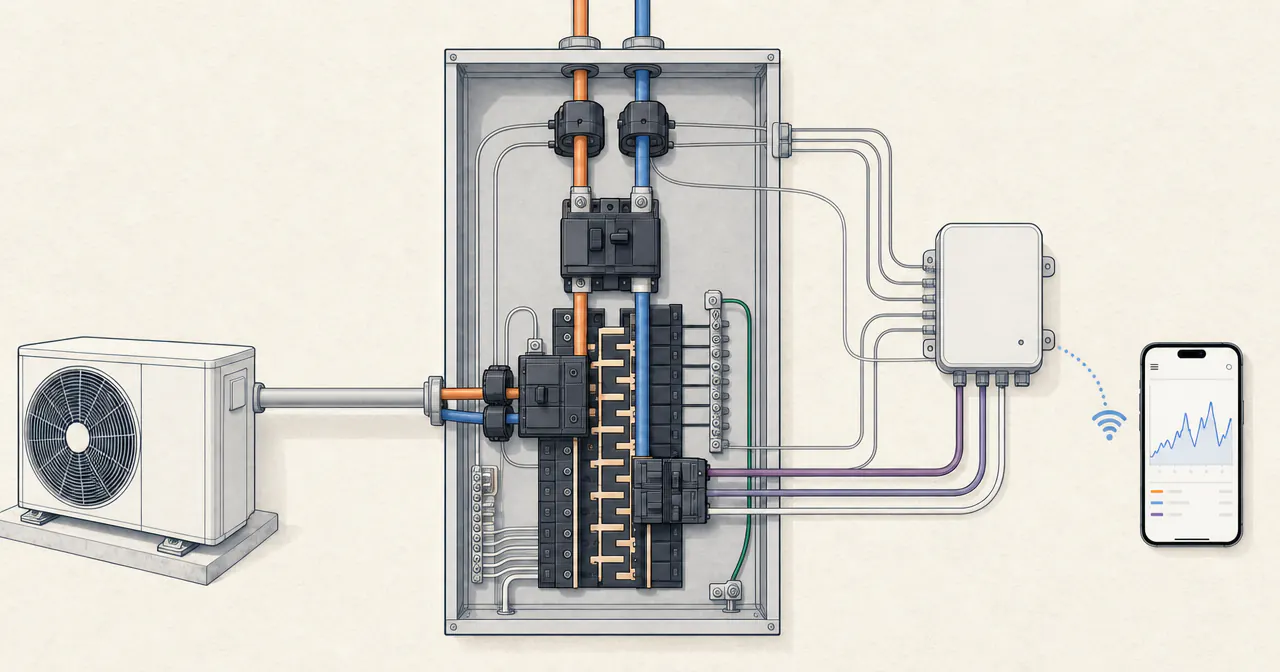
Simplified layout, not wiring instructions.
The app usually reports three quantities:
- Watts or kilowatts: the rate of power use right now
- Kilowatt-hours: energy used over time; one kWh is one kW sustained for one hour
- Estimated cost: measured kWh multiplied by the applicable rate
Duration matters as much as power. EIA reported average U.S. residential revenue of 18.44 cents per kWh for May 2026. That figure is national electricity revenue divided by residential sales. It is a useful comparison proxy, not a household's marginal or avoidable tariff.
| Constant-load illustration | Energy | Cost at 18.44¢/kWh |
|---|---|---|
| 4.5 kW sustained for 45 minutes | 3.375 kWh | $0.62 |
| 200 W sustained for a 30-day month | 144 kWh | $26.55 |
The brief 4.5 kW spike looks dramatic on a live graph. The quiet 200-watt load uses far more energy over a month. Historical kWh is therefore more useful for cost decisions than the largest momentary peak.
A consumer monitor is separate from the utility's revenue meter, which determines the bill. Small differences can come from CT orientation, voltage configuration, unmonitored subpanels, solar flow, sampling, and device accuracy. App estimates can diverge further when they do not fully model fixed charges, tiers, time-of-use periods, taxes, or export credits.
Current home energy monitors compared
The named products and prices below are current as of August 12, 2026. We based our recommendations on official product documentation, technical sheets, support policies, and live manufacturer prices. We have not installed or bench-tested these units.
| Product or route | Direct detail | Current price | Connectivity and data | Best fit and key limit |
|---|---|---|---|---|
| Emporia Vue 3, our default pick | Two mains CTs; zero, eight, or 16 branch CTs; stated ±2% accuracy | $99.99, $149.99, or $199.99 | 2.4 GHz Wi-Fi or 10/100 Ethernet; active internet; cloud app; no user-accessible local storage or local API | Strong value for direct circuit and solar data; cloud-dependent |
| Siemens Inhab | Up to three 200 A mains and 16 branch CTs; stated ±2% accuracy | Retailer price varies | 2.4 GHz Wi-Fi or 10/100 Ethernet; cloud app | Three-phase capability and Ethernet; cloud-dependent |
| IoTaWatt Monitoring Pro Kit V6.4 | 14 CT inputs; kit includes two mains and 12 branch CTs | US$495 for U.S. buyers or C$675 in Canada, plus shipping | 2.4 GHz Wi-Fi; local web interface, history, API, and Home Assistant support | Local-first data and flexible configuration; higher cost and technical setup |
| Sense panel monitor | Mains sensing with inferred device detection | Direct sales discontinued; remaining inventory varies | 2.4 GHz Wi-Fi; cloud app | Automatic device discovery; uncertain inventory and incomplete detection |
| Sense-enabled utility meter | Whole-home data with inferred devices | No separate monitor charge for eligible customers | Utility rollout plus home Wi-Fi; cloud app | No-panel option in eligible service areas; currently unavailable for solar homes |
| Emporia Utility Connect | Whole-home meter data; no branch CTs | $39.99 | Compatible utility meter; 2.4 GHz Wi-Fi; cloud app | Low-cost live totals where the meter and utility support it |
Emporia Vue 3 measures selected circuits directly and supports solar monitoring. An active internet connection is required through 2.4 GHz Wi-Fi or 10/100 Ethernet. Readings are accessed through Emporia's cloud, with no local storage available to the user. That makes it a poor fit for a local-only system even though the sensor hardware is good value.
Siemens Inhab is the closest mainstream direct-sensing alternative. It supports one-second reporting, solar and net-metering configurations, and Wi-Fi or Ethernet. Its capacity for three mains CTs also makes it relevant to compatible three-phase services.
IoTaWatt is the local-first choice for a technical owner. The Pro Kit costs US$495 for U.S. buyers or C$675 in Canada, plus shipping. Its base unit, plug-in USB power supply, and plug-in voltage-reference adapter remain outside the panel. A qualified electrician places the CTs and routes their signal leads using the certified accessory combination specified for the unit. The extra cost buys local history, a browser interface, integrations, and control over data retention.
Sense stopped direct sales of its panel monitor on December 31, 2025 and now focuses on Sense-enabled utility meters. Any panel unit for sale is remaining inventory. Seller status changes the warranty position: an original purchase from a certified reseller can carry a one-year warranty with proof of purchase and delivery, while secondhand or other remaining stock may carry none. We would not make discontinued Sense hardware the default choice.
Meter-based Sense depends on an eligible utility partnership, a compatible rollout, and account enablement. The utility determines where and when it is offered. Sense says this version does not currently support homes with solar.
Choose direct circuit data or inferred appliance data
Two monitors can both claim appliance insight while producing it in different ways.
Direct circuit monitoring places a CT around each selected branch conductor. The result is dependable for a dedicated load such as an EV charger or water heater. A circuit that serves several rooms still appears as one combined total. Direct sensing is our choice for project planning because the monitored load is known from the start.
Inferred appliance monitoring, also called load disaggregation, studies the electrical signature at the mains and estimates which devices switched on. It uses fewer panel sensors and can attach friendly appliance names to data. Detection takes time, variable-speed equipment is difficult to separate, and some consumption may remain unidentified. It is better suited to general discovery than to measuring a known circuit for an upgrade.
Features that earn their cost
Enough channels for the large loads
Count the dedicated circuits that can change the bill or an upgrade decision. HVAC, electric resistance backup, water heating, EV charging, a pool or well pump, a range, and solar usually deserve priority over bedroom receptacles. Eight channels can cover the main systems in a simple home. Sixteen suit multi-zone or highly electrified homes.
Electrical and physical compatibility
The monitor has to match the service type, conductor size, panel count, and enclosure. Standard CTs fit common insulated conductors. Busbar-only access can require flexible sensors. Three-phase homes need a monitor and sensor layout designed for three phases. Equipment mounted near an outdoor panel needs the appropriate environmental rating.
Correct solar and battery flows
A useful solar configuration distinguishes grid import, grid export, household consumption, and solar production in the home's wiring arrangement. Line-side solar taps, battery-backed subpanels, and multiple inverters complicate sensor placement. The electrician or solar installer should include final CT locations and software configuration in the scope.
Rate schedules and exportable history
Cost estimates improve when the app represents the actual time-of-use periods. Raw kWh export is more durable than a dashboard because it can be reanalyzed after a rate change. Local storage, an official API, and CSV export also reduce dependence on one company's app.
Privacy that matches the data
High-frequency electricity data can reveal more than a monthly bill. A peer-reviewed study using more than 5,000 homes found that smart-meter patterns had strong predictive power for occupancy. Cloud monitors send household load patterns outside the home. Local-first systems keep the primary record on the device. Retention, third-party sharing, account deletion, and export rights belong in the buying decision.
Independent safety certification
Panel equipment should carry recognized U.S. safety certification for its intended use. Emporia Vue 3 is UL certified, Siemens Inhab is certified to UL 61010 and UL 2808, and IoTaWatt carries an ETL mark. Certification does not make an energized panel a homeowner workspace.
Installation belongs with an electrician
Turning off the main breaker does not de-energize the service conductors and lugs ahead of it. They retain fatal shock and arc-flash hazards. A panel monitor also needs a distinct voltage or power connection, suitable overcurrent protection, orderly CT signal leads, adequate enclosure space, and a configuration that follows its instructions and the locally adopted electrical code.
We recommend licensed-electrician installation for every monitor with components inside a panel. The scope should identify the monitor, CT sizes, monitored circuits, external mounting location where required, power and voltage connection, solar direction, panel and subpanel relationships, and final labels. The homeowner can complete account and network setup after the panel is closed.
Renters and anyone without exclusive panel access still have two useful choices: utility interval data and a listed plug-in meter used within its voltage and current rating. A plug-in meter cannot measure a range, central HVAC system, hardwired water heater, or most Level 2 EV chargers.
Turn the first month of data into decisions
The monitor runs continuously, so useful analysis does not require watching a live graph. A first month should produce five outputs.
- A seven-day whole-home baseline. Daily kWh and the lowest stable overnight demand show the starting point.
- A ranked circuit list. Total kWh identifies the loads that dominate the month. Peak watts alone can mislead.
- A normal runtime pattern. Water heaters, sump pumps, HVAC, well pumps, and refrigerators cycle. An increase in runtime can reveal more than one high start-up spike.
- A time-of-use map. Flexible loads that overlap expensive periods become scheduling candidates. Our off-peak electricity guide explains how to map hours to the actual rate plan.
- One measured action. A repaired control, new schedule, retired second refrigerator, or reduced standby group should create a visible before-and-after change in kWh.
For a constant load on a predictable schedule, the annual operating-cost screen is:
Annual cost = watts ÷ 1,000 × hours per day × operating days × avoidable electricity price per kWh
Cycling and variable-speed equipment need measured kWh over representative days. Weather-sensitive HVAC also needs similar outdoor conditions for a fair comparison.
What the data adds to an electrification plan
A circuit monitor is useful before and after a heat pump, heat pump water heater, EV charger, solar array, or battery project.
- Heat pumps: Direct monitoring separates HVAC kWh from the house and shows resistance-backup operation. Existing consumption is a bill baseline, while equipment sizing still comes from a heating and cooling load calculation. Our heat pump electricity cost guide turns seasonal kWh and local rates into operating cost.
- EV charging: A passive monitor reports charging demand and overlap with other loads. It cannot control capacity. Dynamic control requires a separately designed, compatible, listed energy-management or load-management system with its specified sensors, controller, EVSE, communication path, and fail-safe behavior. Our EV charger load-management guide explains when an accepted system can avoid a larger service.
- Solar and batteries: Import, export, and circuit data show how much daytime production the house uses directly. Several weeks of summer data cannot represent a full year of production and consumption.
- Electrical service: Historical demand can inform an electrician's analysis, but a consumer monitor record does not automatically satisfy a load-calculation method. The electrician applies a route permitted by the locally adopted code, and the authority having jurisdiction determines whether data-based documentation is accepted. Our 200-amp service cost guide covers the work when an accepted calculation shows an upgrade is needed.
- Circuit control: Passive monitoring only reports. A compatible listed system can limit or sequence loads. When monitoring and control are both part of a panel replacement, compare that route with a smart electrical panel.
Are home energy monitors worth it?
They are worth the cost when the data has a named job. Examples include finding an unexplained base load, measuring expensive hardwired systems, shifting EV or water-heating demand, tracking solar self-consumption, or documenting an upgrade's result. Utility data or a plug-in meter is the better purchase when it can answer the question.
Savings studies provide useful context, though they do not predict the result from a purchased U.S. branch-circuit monitor. A 2025 randomized trial followed 802 Dutch households that had applied for a free in-home display. Over about ten months, the display reduced electricity use by 2.2%. A systematic review of 12 disaggregated-feedback studies found an average reduction of 4.5%, while noting likely opt-in bias and finding no robust advantage over aggregate feedback.
Treat those percentages as sensitivity points rather than expected savings. The annual benefit calculation is:
Annual benefit = baseline annual kWh × measured reduction share × actual avoidable usage-linked tariff
Suppose a home uses 10,000 kWh per year and its actual avoidable tariff is $0.18 per kWh. A 2.2% reduction is 220 kWh and $39.60 per year. A 4.5% reduction is 450 kWh and $81 per year. A $200 monitor would have a hardware-only simple payback of about 5.1 years at the first value or 2.5 years at the second. Electrician labor extends either period.
The avoidable tariff includes only charges that change when consumption changes, such as applicable energy, delivery, fuel-adjustment, tier, or time-of-use charges. Fixed monthly charges, minimum bills, and other charges unaffected by kWh stay out. For time-of-use service, each avoided interval is worth its applicable rate rather than a national average.
Our rule is simple: buy the least expensive monitor that answers a real question, favor direct sensors for important circuits, and define the action before collecting data. When the result puts a heat pump, EV circuit, water heater, or panel project at the top of the list, use our incentive library to find programs that can lower the project cost.